|
Даю задания для студентов. Они хотят повторно пройти курс. Как отписаться от выполненного курса, что бы пройти его заново? |
JavaScriptAPI
Презентацию к данной лекции можете скачать здесь.
В ходе работы над лекцией были использованы образцы картографических сервисов компаний Microsoft, Google, ESRIи Yahoo!
В настоящее время мы являемся свидетелями бурного роста различных картографических сервисов. Многие лидеры в области ГИС-технологий, такие, как ESRI, Microsoft, Google и другие предоставляют программистам инструменты, обеспечивающие доступ к своим картографическим сервисам. В качестве инструмента доступа к ресурсам часто выступают JavaScriptAPI.
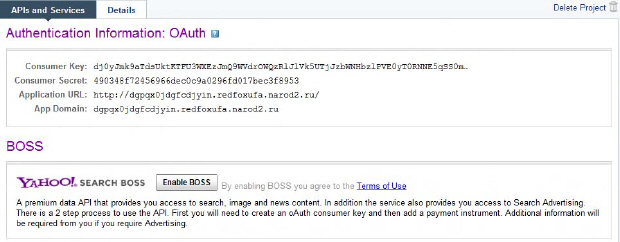
Если мы захотим использовать в своих веб-приложениях картографические сервисы Microsoft, ESRI, Yahoo! или Google, вначале потребуется получить уникальный ключ. Получить ключ можно зарегистрировавшись на сайтах http://www.bingmapsportal.com/http://www.bingmapsportal.com/,http://www.esri.com, http://developer.yahoo.com/maps/ajax/ или https://developers.google.com/maps/documentation/javascript/reference?hl=ru.
Получение ключа для картографических сервисов Yahoo!
Для отображения на веб-странице карт обычно используются специализированные элементы управления. Сами карты хранятся на серверах компаний, предоставляющих сервис. На клиентские приложения карты закачиваются в режиме он-лайн.
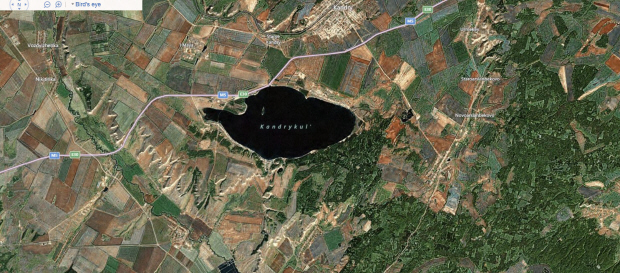
Программист может выбрать масштаб и регион, отображаемый при начальной загрузке веб-страницы. Возможно также задать размер окна вывода карты. Проиллюстрируем сказанное на следующем примере (sample_1).
<!DOCTYPEhtmlPUBLIC"-//W3C//DTDXHTML 1.0 Transitional//EN""
http://www.w3.org/TR/xhtml1/DTD/xhtml1-transitional.dtd">
<html>
<head>
<title>Карта</title>
<metahttp-equiv="Content-Type"content="text/html; charset=utf-8"/>
<scripttype="text/javascript"
src="http://ecn.dev.virtualearth.net/mapcontrol/mapcontrol.ashx?v=7.0"></script>
<scripttype="text/javascript">
var map = null;
functiongetMap() {
              map = newMicrosoft.Maps.Map(document.getElementById('myMap'), {
                  credentials: 'AqCnwcyoxN8o6P1nM76x9QNHNMvHLf5pQa-H8L77yju6wcBx2vwvWUniEEpR-ifw',
                  center: newMicrosoft.Maps.Location(54.50277778, 54.06388889),
                  mapTypeId: Microsoft.Maps.MapTypeId.birdseye, zoom: 12 });
          }
</script>
</head>
<bodyonload="getMap();">
<divid='myMap'style="position:relative; width:1920px; height:1080px;"></div>
</body>
</html>
Для отображения карты вначале мы получили ключ:
'AqCnwcyoxN8o6P1nM76x9QNHNMvHLf5pQa-H8L77yju6wcBx2vwvWUniEEpR-ifw
Далее, мы разместили на веб-странице элемент управления Map, указали начальные координаты загрузки: 54.50277778 градуса северной широты и 54.06388889 градуса восточной долготы и коэффициент масштабирования - 12. Здесь хотелось бы отметить следующее. В одном градусе - 60 минут, в одной минуте - 60 секунд, в одном градусе - 3600 секунд. То есть,  и
и  (координаты озера Кандры-Куль) в пересчете в десятичную систему координат составят
  градусов северной широты и
  градусов восточной долготы.
Аналогичных результатов можно добиться, используя картографический сервис компании ESRI (sample_2).
<!doctypehtml>
<htmllang="en">
<head>
<metacharset="utf-8">
<metahttp-equiv="X-UA-Compatible"content="IE=7,IE=9"/>
<metaname="viewport"content="initial-scale=1, maximum-scale=1,user-scalable=no"/>
<title></title>
<linkrel="stylesheet"
href="http://serverapi.arcgisonline.com/jsapi/arcgis/3.0/js/dojo/dijit/themes/tundra/tundra.css">
<linkrel="stylesheet"
href="http://serverapi.arcgisonline.com/jsapi/arcgis/3.0/js/esri/dijit/css/Popup.css">
<style>
html, body { height: 100%; width: 100%; margin: 0; padding: 0; }
#map{ margin: 0; padding: 0; }
</style>
<script>vardojoConfig = { parseOnLoad: true };</script>
<scriptsrc="http://serverapi.arcgisonline.com/jsapi/arcgis/?v=3.0"></script>
<script>
dojo.require("dijit.layout.BorderContainer");
dojo.require("dijit.layout.ContentPane");
dojo.require("esri.map");

var map;
functioninit() {
varext = newesri.geometry.Extent({ "xmin": -17878954, "ymin": -2368856, "xmax":
11003235, "ymax": 12170078, "spatialReference": { "wkid": 102100 } });
            map = newesri.Map("map", {
"extent": ext,
"fadeOnZoom": true,
"force3DTransforms": true,
"navigationMode": "css-transforms"
            });
varbasemap = new esri.layers.ArcGISTiledMapServiceLayer
("http://server.arcgisonline.com/ArcGIS/rest/services/World_Topo_Map/MapServer");
map.addLayer(basemap);

dojo.connect(map, 'onLoad', function () {
dojo.connect(dijit.byId('map'), 'resize', map, map.resize);
            });
        }
dojo.ready(init);
</script>
</head>

<bodyclass="tundra">
<divdata-dojo-type="dijit.layout.BorderContainer"
data-dojo-props="design:'headline',gutters:false"
style="width: 100%; height: 100%; margin: 0;">
<divid="map"
data-dojo-type="dijit.layout.ContentPane"
data-dojo-props="region:'center'">
</div>
</div>
</body>
</html>
В следующем примере (sample_3) продемонстрирована возможность геолокации. Аналогичный пример для BingMaps рассматривался во второй лекции.
<!DOCTYPEhtml>
<html>
<head>
<metahttp-equiv="Content-Type"content="text/html; charset=utf-8">
<metahttp-equiv="X-UA-Compatible"content="IE=7,IE=9"/>
<metaname="viewport"content="initial-scale=1.0, width=device-width,
maximum-scale=1.0, user-scalable=no"/>
<!-- meta tags to hide url and minimize status bar to give the web app
    a native app look this only happens after app is saved to the desktop-->
<metaname="apple-mobile-web-app-capable"content="yes"/>
<metaname="apple-mobile-web-app-status-bar-style"content="translucent-black"
/>
<metahttp-equiv="Content-Type"content="text/html; charset=utf-8"/>
<title>
Geolocation API
</title>
<scripttype="text/javascript"src="http://serverapi.arcgisonline.com/jsapi/arcgis/?v=3.0compact">
</script>
<!-- Details about the Webkit CSS Properties http://css-infos.net/properties/webkit.php
    and http://www.pointabout.com/category/development-blog/pointabout-dev-help/-->
<styletype="text/css">
html, body
      {
height: 100%;
margin: 0px;
padding: 0px;
width: 100%;
      }

@-webkit-keyframes
pulse
      {
0%
        {
opacity: 1.0;

        }
45%
        {
opacity: .20;

        }
100%
        {
opacity: 1.0;

        }
      }
@-moz-keyframes
pulse
      {
0%
        {
opacity: 1.0;
        }
45%
        {
opacity: .20;

        }
100%
        {
opacity: 1.0;
        }
      }

#map_graphics_layer
      {
-webkit-animation-duration: 3s;
-webkit-animation-iteration-count: infinite;
-webkit-animation-name: pulse;
-moz-animation-duration: 3s;
-moz-animation-iteration-count: infinite;
-moz-animation-name: pulse;
      }
</style>
<scripttype="text/javascript">
dojo.require("esri.map");
var map;
var graphic;
varcurrLocation;
varwatchId;

functioninit() {

varinitExtent = newesri.geometry.Extent({ "xmin": -19851613, "ymin": -5635549, "xmax":
714227, "ymax": 9509989, "spatialReference": { "wkid": 102100 } });
            map = newesri.Map("map", {
                wrapAround180: true,
                extent: initExtent
            });
dojo.connect(map, "onLoad", initFunc);
vartiledMapServiceLayer = new esri.layers.ArcGISTiledMapServiceLayer
("http://services.arcgisonline.com/ArcGIS/rest/services/Ocean_Basemap/MapServer");
map.addLayer(tiledMapServiceLayer);

        }

functionorientationChanged() {
if (map) {
map.reposition();
map.resize();
            }
        }


functioninitFunc(map) {
dojo.connect(window, 'resize', map, map.resize);
if (navigator.geolocation) {
navigator.geolocation.getCurrentPosition(zoomToLocation, locationError);
watchId = navigator.geolocation.watchPosition(showLocation, locationError);
            }
else {
                alert("Browser doesn't support Geolocation. Visit http://caniuse.com to discover browser
 support for the Geolocation API.");
            }
        }

functionlocationError(error) {
//error occurred so stop watchPosition
if (navigator.geolocation) {
navigator.geolocation.clearWatch(watchId);
            }
switch (error.code) {
caseerror.PERMISSION_DENIED:
                    alert("Location not provided");
break;

caseerror.POSITION_UNAVAILABLE:
                    alert("Current location not available");
break;

caseerror.TIMEOUT:
                    alert("Timeout");
break;

default:
                    alert("unknown error");
break;
            }

        }


functionzoomToLocation(location) {
varpt = esri.geometry.geographicToWebMercator(newesri.geometry.Point(location.coords.longitude, location.coords.latitude));
addGraphic(pt);

map.centerAndZoom(pt, 12);
        }

functionshowLocation(location) {
//zoom to the users location and add a graphic
varpt = esri.geometry.geographicToWebMercator(newesri.geometry.Point(location.coords.longitude, location.coords.latitude));
if (!graphic) {
addGraphic(pt);
            }
else { //move the graphic if it already exists
graphic.setGeometry(pt);
            }
map.centerAt(pt);
        }

functionaddGraphic(pt) {
var symbol = new esri.symbol.SimpleMarkerSymbol(esri.symbol.SimpleMarkerSymbol.STYLE_CIRCLE, 12,
new esri.symbol.SimpleLineSymbol(esri.symbol.SimpleLineSymbol.STYLE_SOLID,
newdojo.Color([210, 105, 30, 0.5]), 8),
newdojo.Color([210, 105, 30, 0.9])
        );
            graphic = newesri.Graphic(pt, symbol);
map.graphics.add(graphic);
        }


dojo.addOnLoad(init);
</script>
</head>

<bodyonorientationchange="orientationChanged();">
<divid="map"style="width:100%; height:100%;">
</div>
</body>

</html>
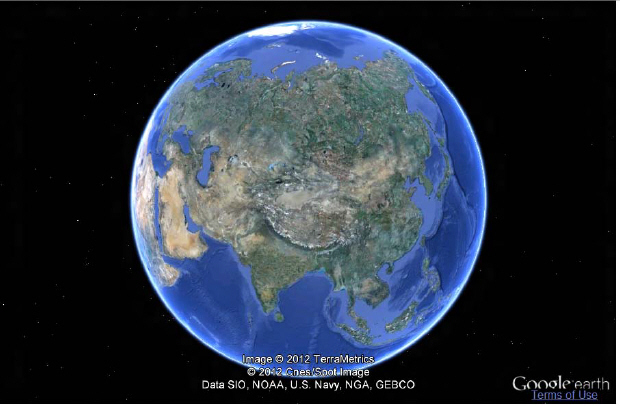
Компания Google известна своими картографическими сервисами GoogleEarth и GoogleMaps. Рассмотрим некоторые из возможностей данных продуктов, которые программисты могут использовать в своих проектах.
Предлагаемый ниже пример (sample_4) интересен тем, что позволяет отображать поверхность не только Земли, но и Луны и Марса.
<!DOCTYPEhtml>
<html>
<!--
Copyright 2009 Google Inc.

Licensed under the Apache License, Version 2.0 (the "License");
you may not use this file except in compliance with the License.
You may obtain a copy of the License at

     http://www.apache.org/licenses/LICENSE-2.0

Unless required by applicable law or agreed to in writing, software
distributed under the License is distributed on an "AS IS" BASIS,
WITHOUT WARRANTIES OR CONDITIONS OF ANY KIND, either express or implied.
See the License for the specific language governing permissions and
limitations under the License.
-->
<head>
<title>Образцы Google Earth API</title>
<metahttp-equiv="content-type"content="text/html; charset=utf-8"/>
<!-- You should probably remove most of this extra cruft if you're copying
       this sample! -->
<styletype="text/css">@import"static/examples.css";</style>
<styletype="text/css">@import"static/prettify/prettify.css";</style>
<scripttype="text/javascript"src="static/prettify/prettify.js"></script>

<!-- Change the key below to your own Maps API key -->
<scripttype="text/javascript"src="http://www.google.com/jsapi?hl=en&
key=ABQIAAAAwbkbZLyhsmTCWXbTcjbgbRSzHs7K5SvaUdm8ua-Xxy_-2dYwMxQMhnagaawTo7L1FE1-amhuQxIlXw"></script>
<scripttype="text/javascript">
functionupdateSphere() {
varsphereNode = document.getElementById('sphere');
var options = {};
if (sphereNode.value == 'moon' ||
sphereNode.value == 'mars')
              options = { database: 'http://khmdb.google.com/?db=' + sphereNode.value };

document.getElementById('map3d').innerHTML = '';
google.earth.createInstance('map3d', initCB, failureCB, options);
      }

google.load("earth", "1");

functioninit() {
updateSphere();
      }

functioninitCB(instance) {
ge = instance;
ge.getWindow().setVisibility(true);

// add a navigation control
ge.getNavigationControl().setVisibility(ge.VISIBILITY_AUTO);


document.getElementById('installed-plugin-version').innerHTML =
ge.getPluginVersion().toString();
      }

functionfailureCB(errorCode) {
      }
</script>
</head>
<bodyonload="if(window.prettyPrint)prettyPrint();init();">
<h1>Образцы Google Earth API</h1>
<divstyle="clear: both;"></div>
<divid="ui"style="position: relative;">
<divid="map3d"style="border: 1pxsolidsilver; width: 500px; height: 500px;"></div>
<divid="extra-ui"style="position: absolute; left: 520px; top: 0;">
Выберитесферу:
<selectid="sphere"onchange="updateSphere()">
<optionvalue="earth">Земля</option>
<optionvalue="mars">Марс</option>
<optionvalue="moon">Луна</option>
</select>
</div>
</div>
</body>
</html>
Еще одна реализация моделирования земной поверхности находится в папке (sample_5).
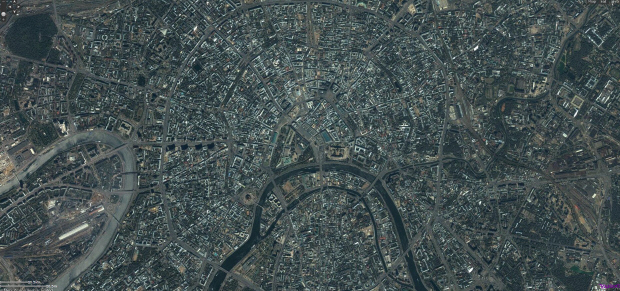
Интересными возможностями обладают также картографические сервисы компании Yahoo! Посмотреть на Москву с высоты птичьего полета можно благодаря следующему примеру (sample_6).
<html>
<head>
<scripttype="text/javascript"
src="http://api.maps.yahoo.com/ajaxymap?v=3.8&appid=Yxx.9xPV34GOzV1ENV6Y6CplIev43djVQM2mzx8xI3YbdPCL_
 OYLwTElNMBh3mKivzxRNOIdzgMyugEbt_RbAprigW55gLc-"></script>
<styletype="text/css">
#map{
height: 100%;
width: 100%;
}
</style>
</head>
<body>
<divid="map"></div>

<scripttype="text/javascript">
// Create a map object
var map = newYMap(document.getElementById('map'));

// Add map type control
map.addTypeControl();

// Add map zoom (long) control
map.addZoomLong();

// Add the Pan Control
map.addPanControl();

// Set map type to either of: YAHOO_MAP_SAT, YAHOO_MAP_HYB, YAHOO_MAP_REG
map.setMapType(YAHOO_MAP_SAT);

// Display the map centered on a geocoded location
map.drawZoomAndCenter("Moscow, Russia", 4);
</script>
</body>
</html>
С помощью следующего примера (sample_7) можно познакомиться с московскими улицами.
<html>
<head>
<script type="text/javascript"
src="http://api.maps.yahoo.com/ajaxymap?v=3.8&appid=Yxx.9xPV34GOzV1ENV6Y6CplIev43djVQM2mzx8xI3YbdPCL_
 OYLwTElNMBh3mKivzxRNOIdzgMyugEbt_RbAprigW55gLc-"></script>
<style type="text/css">
#map{
height: 100%;
width: 100%;
}
</style>
</head>
<body>
<div id="map"></div>
<script type="text/javascript">
    // Create a Map that will be placed in the "map" div.
var map = new YMap(document.getElementById('map'));
    function startMap(){
        // Add the ability to change between Sat, Hybrid, and Regular Maps
map.addTypeControl();
        // Add the zoom control. Long specifies a Slider versus a "+" and "-" zoom control
map.addZoomLong();
        // Add the Pan control to have North, South, East and West directional control
map.addPanControl();
        // Specifying the Map starting location and zoom level
map.drawZoomAndCenter("Moscow", 3);
        // Add an event to report to our Logger
YEvent.Capture(map, EventsList.MouseClick, reportPosition);
        function reportPosition(_e, _c){
            // It is optional to specify the location of the Logger.
            // Do so by sending a YCoordPoint to the initPos function.
varmapmapCoordCenter = map.convertLatLonXY(map.getCenterLatLon());
YLog.initPos(mapCoordCenter); //call initPos to set the starting location
            // Printing to the Logger
YLog.print("You Made a MouseClick!");
YLog.print("Latitude:" + _c.Lat);
YLog.print("Longitude:" + _c.Lon);

YLog.print("Adding marker at....");
YLog.print(" Latitude:" + _c.Lat + " Longitude:" + _c.Lon);
varcurrentGeoPoint = new YGeoPoint( _c.Lat, _c.Lon );
map.addMarker(currentGeoPoint);
        }
    }
window.onload = startMap;
</script>
</body>
</html>
Завершая разговор о картографических сервисах, хотелось бы порекомендовать для самостоятельного изучения publicmapsgallery компании ESRI.


